07 / CLOUD & DEVOPS / CASE STUDY
CloudWatch Monitoring & Alerting Lab
Making infrastructure signals and alarm configuration visible.
Documented operations lab Inspect source on GitHub ↗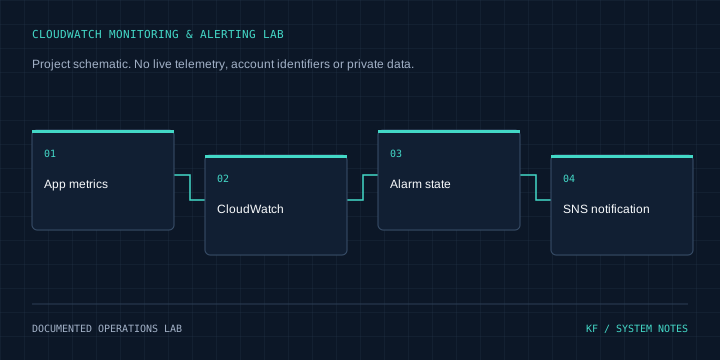
Architecture
App metrics → CloudWatch → Alarm state → SNS notification
Problem & context
An application can fail without a useful signal unless metrics, alarms and response procedures are designed together.
Objectives
Practice metric selection, CloudWatch alarm setup and a documented notification path.
My role & project work
Configured a CPU-utilization alarm and documented CloudWatch dashboard/SNS alerting practices for an AWS application lab.
Technical implementation
Reviewed console screenshots show a configured CPU alarm. The README describes dashboard widgets for compute, database and ALB signals, plus SNS notifications and cost-estimation exercises.
Engineering decisions
Choose signals that connect compute load, application traffic and errors. Treat an alarm definition as configuration evidence rather than proof that an incident notification was delivered.
Challenges & solutions
The inspected alarm screenshot shows Insufficient data. A load/notification test and recorded state transition are still needed before claiming successful alert delivery or automatic remediation.
Testing & verification
Reviewed README and alarm screenshots at revision fc216d35fd484dba7d1a16d49d95e709b92d5863. No current AWS access was used. Pricing-calculator estimates and percentage-savings claims were excluded from the portfolio/CV.
Current status
Documented monitoring lab. Alarm configuration is evidenced; incident detection performance, notification delivery and savings are not measured here.
Lessons & next steps
Useful observability evidence includes a signal, threshold, state transition, notification receipt and response notes, not just a dashboard screenshot.